Sharp thinking starts with a structured approach.
Whether you’re solving a client’s problems, crafting a startup growth strategy, formulating an investment thesis, or deciding where to focus your time, the right mental model can help you focus on what matters, and cut through the noise.
The late Charlie Munger once noted that, “You’ve got to have models in your head. And you’ve got to array your experience on this latticework of models”.
This page curates 51 of the most useful mental models for consultants, founders, and sharp thinkers, organised into 8 categories:
- Decision making & goal setting
- Entrepreneurship
- Finance & investing
- Management & operations
- Marketing
- Mergers & acquisitions
- Strategy
- Structured thinking
1. Decision Making & Goal Setting
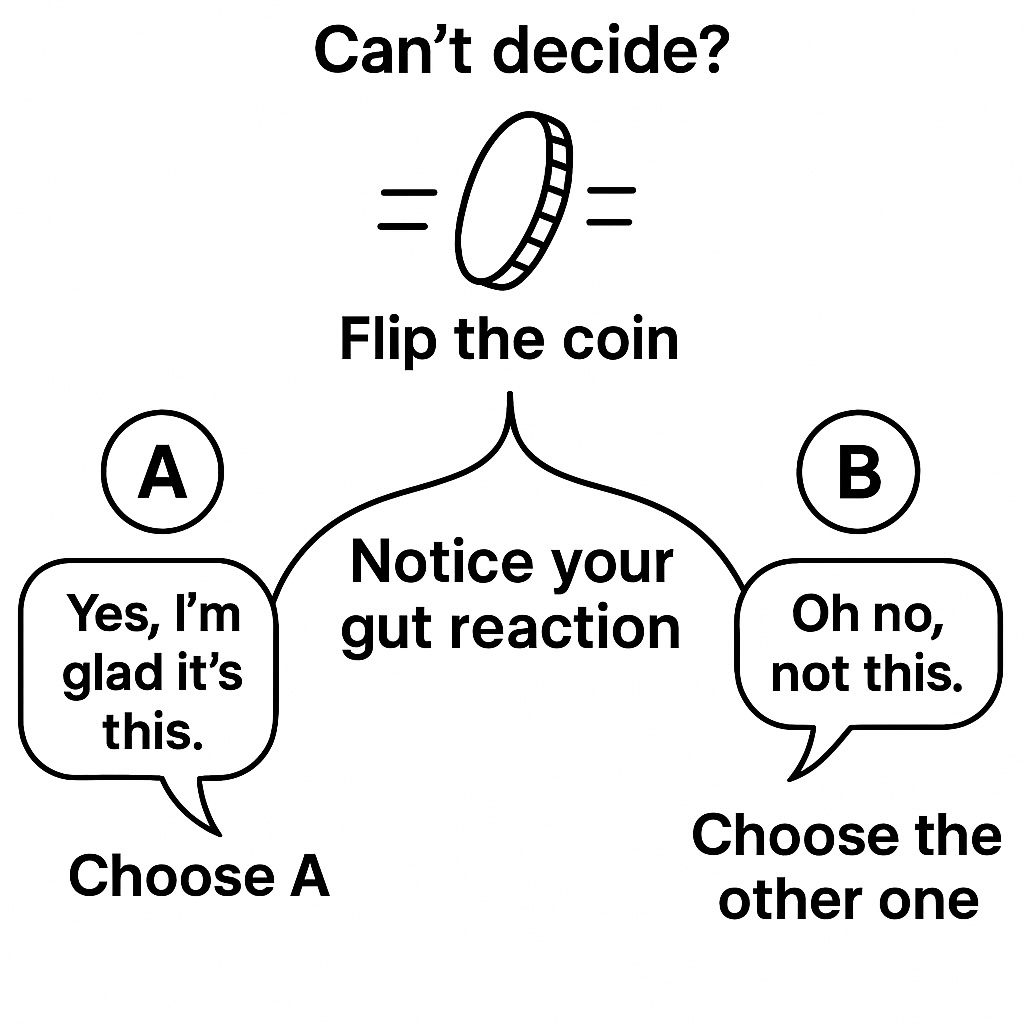
The Coin Flip is a deceptively simple decision-making technique that helps uncover your true preferences. By assigning an option to heads and tails and flipping a coin, you prompt an instinctive emotional response, relief or disappointment, when the coin lands. That reaction reveals what you really want, even if your logic has been clouded by overthinking and analysis paralysis. For example, a consultant deciding between two job offers, one with prestige and the other with better work-life balance, might feel an unexpected pang of regret when the coin favours the prestigious path. That feeling is useful data.

Cost Benefit Analysis is a foundational decision-making tool that weighs the expected costs of an action against its anticipated benefits. If the benefits outweigh the costs, the action is considered worthwhile. For instance, a council evaluating whether to build a light rail extension might calculate the upfront cost, ongoing maintenance, and disruption, and weigh that against long-term gains in reduced traffic congestion, increased property values, and carbon savings. The tool helps decision-makers stay grounded in economic rationality, especially when projects involve trade-offs or public funds.
OODA Loop

The OODA Loop, short for Observe, Orient, Decide, Act, is a rapid decision-making cycle developed by military strategist John Boyd and now widely used in business, especially in fast-moving or competitive environments. The idea is to cycle through the loop faster than your competitors by constantly updating your understanding and responding with agility. For example, a startup launching a new app might observe user behaviour, orient by analysing friction points, decide on a product tweak, and act by shipping a rapid update. The OODA Loop turns decision-making into a continuous, adaptive process that thrives under uncertainty.
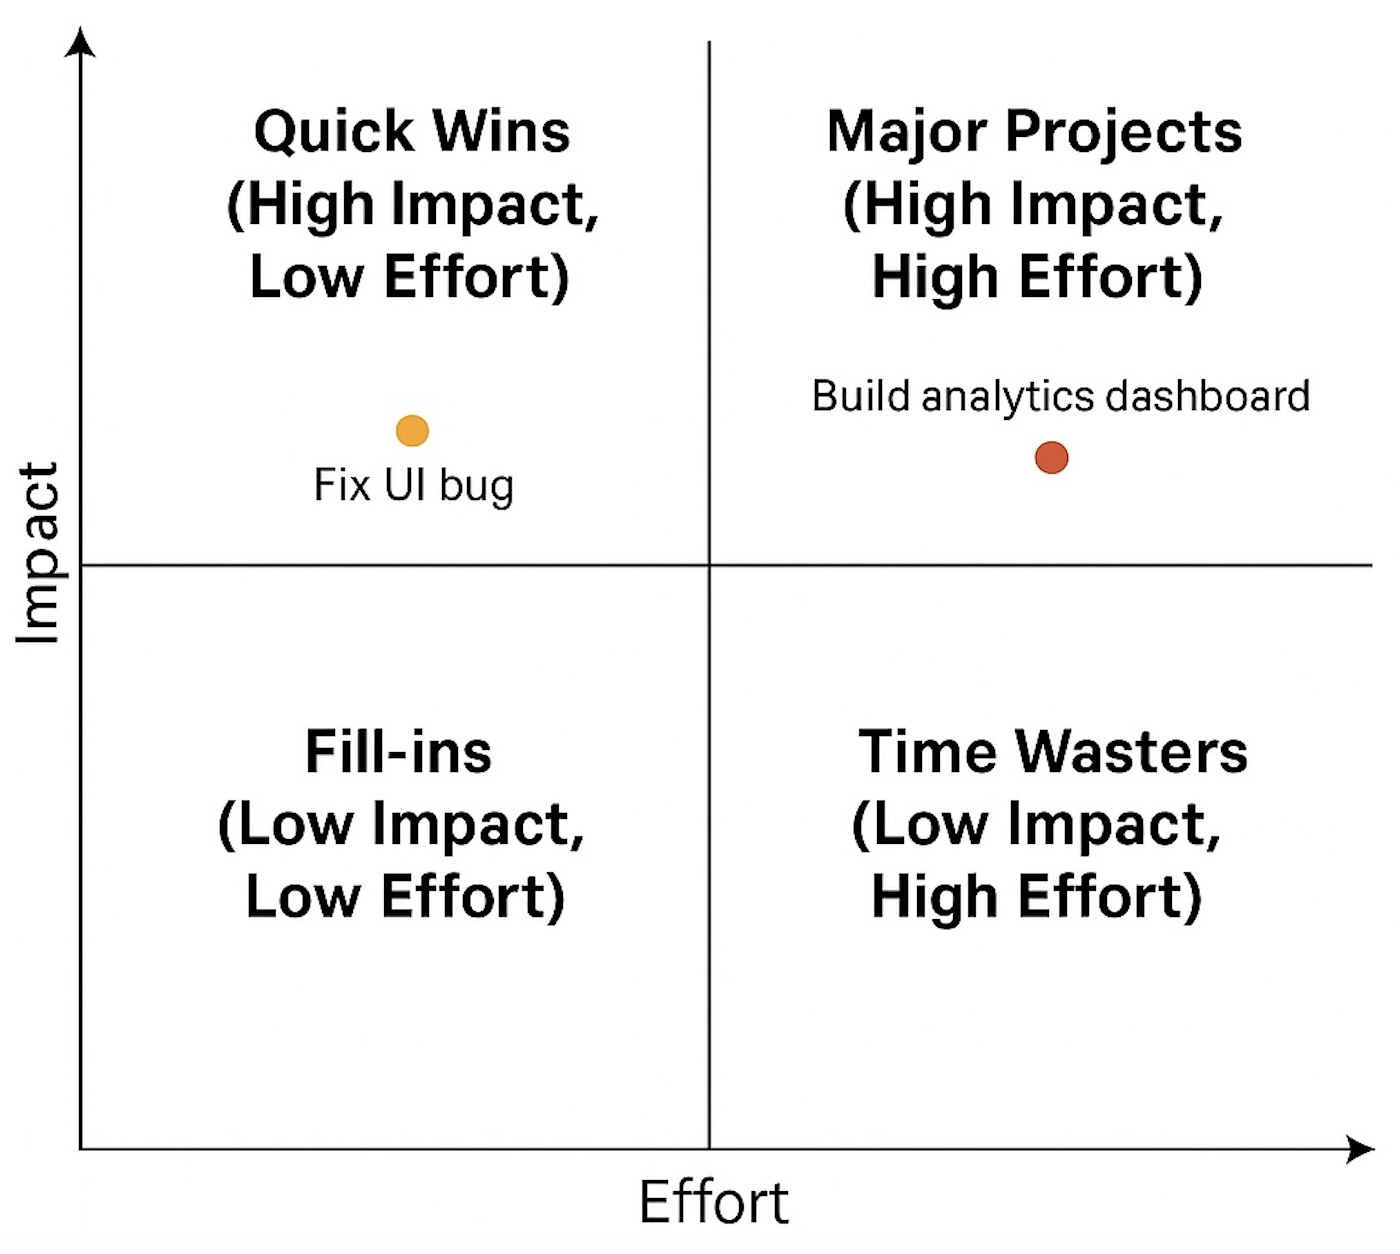
The Priority Matrix (also known as the Impact–Effort Matrix) is a decision tool that helps teams focus resources by categorising tasks into four quadrants: Quick Wins (high impact, low effort), Major Projects (high impact, high effort), Fill-ins (low impact, low effort), and Time Wasters (low impact, high effort). A product team planning their next sprint might use the matrix to decide between building a complex analytics dashboard or fixing a simple but annoying UI bug. If the bug fix is a Quick Win, it gets fast-tracked. The matrix drives strategic focus, cutting noise and surfacing what really matters.

SMART Goals turn vague ambitions into concrete plans by requiring your goals to be Specific, Measurable, Achievable, Relevant, and Time-bound. This structure forces clarity and accountability, making goals easier to track and accomplish. For instance, rather than saying “I want to improve client retention” a SMART version might be: “Increase client retention from 75% to 85% over the next 6 months by implementing a monthly check-in system”.

The Value GROW Model is a coaching and goal-setting framework built around five stages: Values (what matters most), Goals (what you want to achieve), Reality (where you stand now), Options (possible paths forward), and Way Forward (your action plan). It’s often used by mentors, leaders, or consultants working through performance issues or personal development. For instance, a project manager struggling with team dynamics might clarify that their Value is collaboration, their Goal is stronger team cohesion, and their Reality is frequent miscommunication. The GROW structure turns abstract frustration into practical progress.
2. Entrepreneurship
Business Model Canvas

The Business Model Canvas is a one-page visual chart that maps the nine essential elements of a business model: Customer Segments, Value Propositions, Channels, Customer Relationships, Revenue Streams, Key Resources, Key Activities, Key Partnerships, and Cost Structure. It’s widely used by startups and corporates alike to clarify how a business creates, delivers, and captures value. For example, a SaaS company might provide subscription based (Revenue Streams) automated workflow management (Value Proposition) using cloud infrastructure (Key Partnerships). The framework forces teams to see the whole business system on one page, which is ideal for strategy sprints, pivots, or investor pitches.
Lean Canvas

The Lean Canvas is a one-page business model template designed for startups, adapted from the traditional Business Model Canvas. It replaces sections like “Key Partners” with “Problem”, “Solution” and “Unfair Advantage”, forcing early-stage founders to focus on customer pain points and differentiation. For example, a health tech startup might define the problem as inefficient appointment scheduling, propose a solution via an AI-powered booking system, and note their advantage as exclusive hospital partnerships. The Lean Canvas promotes focus, speed, and clear communication during the earliest stages of venture building.

The Map of Life is a narrative strategy framework designed to help professionals and founders tell a compelling story about their product, project, or career. It centres on four key elements: Why (your purpose), For Whom (your target audience), Who (your unique capability or positioning), and What (the product or offering). For example, a social enterprise founder might explain: “We believe students need real-world exposure (Why), we serve disadvantaged high schoolers (For Whom), we’re ex-teachers with tech experience (Who), and we’ve built a mentorship platform that connects them to university students (What).” The framework helps to build clarity and coherence into messaging, internally and externally.
3. Finance & Investing

The 5 C’s of Credit (Character, Capacity, Capital, Collateral, and Conditions) are the bedrock of credit analysis, used by lenders to assess a borrower’s reliability and overall credit risk. Each “C” offers a different lens: Character refers to trustworthiness; Capacity to the ability to repay; Capital to personal investment; Collateral to assets pledged; and Conditions to external factors like the strength of the economy. A bank evaluating a small business loan might look at the owner’s credit history (Character), revenue projections (Capacity), equity contribution (Capital), existing assets like land and equipment (Collateral), and industry outlook (Conditions) before making the loan.
Net Present Value (NPV)

NPV is a foundational tool in finance for evaluating the profitability of an investment by discounting future cash flows to their present value and subtracting the initial investment. A positive NPV means the project is expected to create value. It’s essential in corporate finance, from evaluating capital projects to mergers and acquisitions. For example, a mining company might estimate the lifetime cash flows of a new site, discount them at an appropriate rate, and compare the result to the upfront exploration cost. NPV helps them decide whether to dig, or walk away.
4. Management & Operations
ADKAR Model

The ADKAR Model is a change management framework focused on guiding individuals through transformation by addressing five building blocks: Awareness (of the need for change), Desire (to support change), Knowledge (of how to change), Ability (to implement change), and Reinforcement (to sustain the change). It’s useful in organisational transitions like system rollouts, restructures, or cultural shifts. For example, during a CRM upgrade, a sales team might need to first understand why the old system no longer works (Awareness), and later receive training (Knowledge) and follow-up support (Reinforcement). ADKAR humanises change by targeting the personal transitions that drive organisational transformation.
Balanced Scorecard

The Balanced Scorecard helps organisations translate strategic vision into actionable performance metrics across four dimensions: Financial, Customer, Internal Processes, and Learning & Growth. Rather than relying solely on financial indicators, it encourages a holistic view of performance. For example, a software firm might track recurring revenue (Financial), customer satisfaction (Customer), deployment times (Internal Processes), and training hours per employee (Learning & Growth). The Balanced Scorecard aligns day-to-day execution with long-term goals and creates clarity across departments.
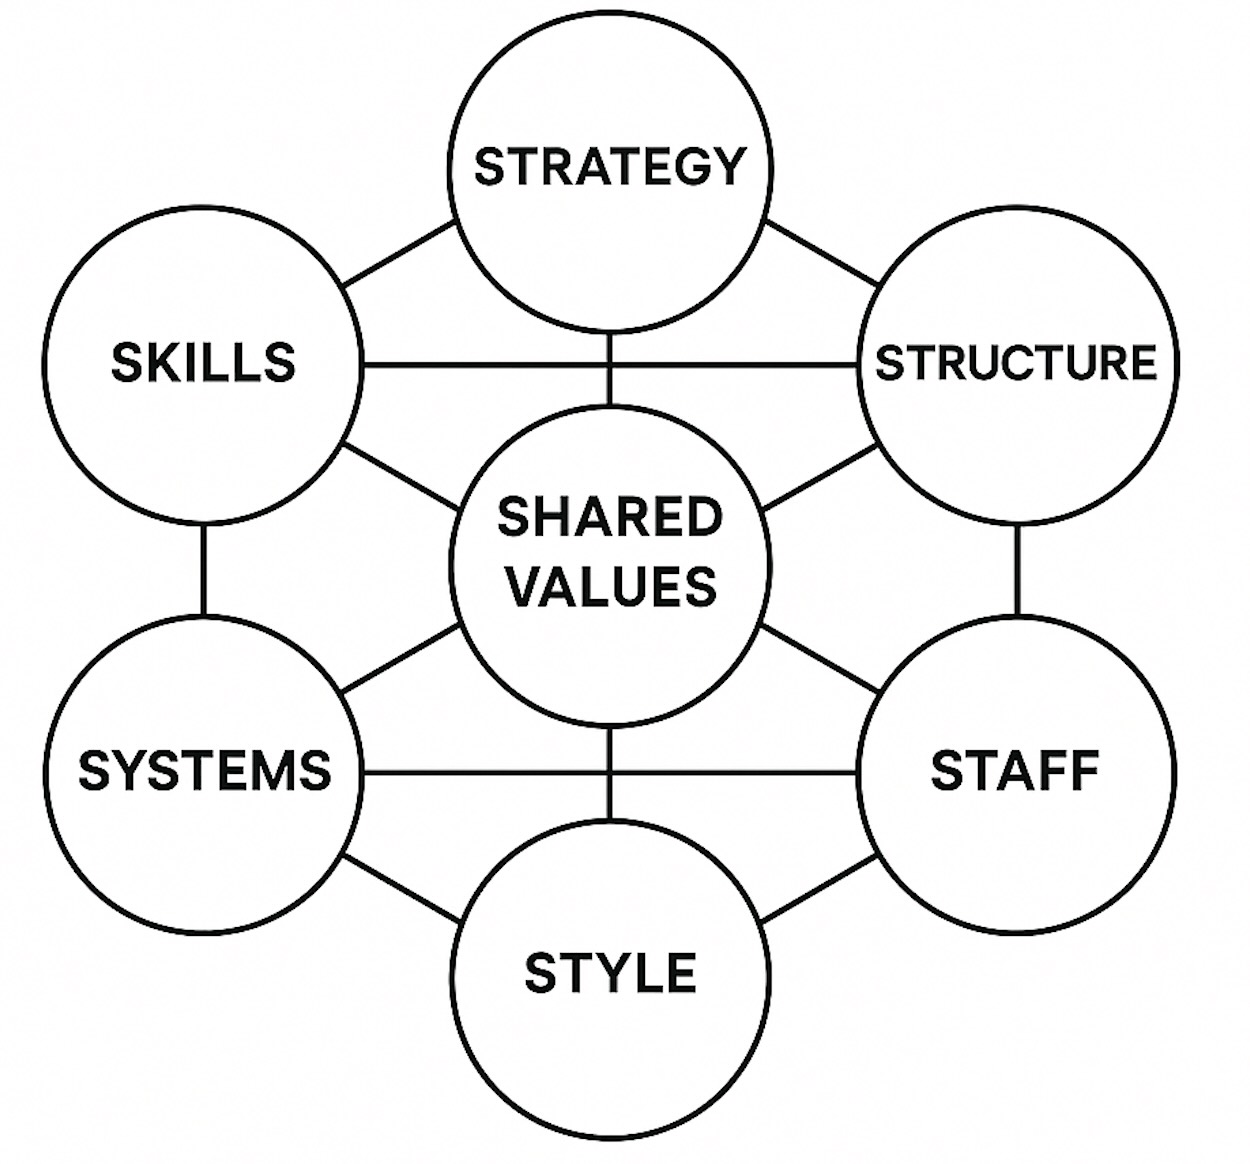
The McKinsey 7 S Framework helps organisations align their internal elements by examining seven interconnected factors: Strategy, Structure, Systems, Shared Values, Skills, Style, and Staff. It’s a powerful diagnostic tool for guiding change management or post-merger integration. For example, a growing tech company expanding into international markets might discover that while their Strategy and Structure are sound, their internal Systems and cross-cultural Staff training are lagging—misalignment that could undermine execution. The 7 S model ensures leaders don’t just shift boxes on an org chart, but harmonise the whole system.
PPP Model (People, Process, Place)

The PPP Model is a human-centred framework often used to improve service experiences, particularly in healthcare and education. It focuses on the interactions between People (staff and users), Process (how services are delivered), and Place (the physical or virtual environment). For instance, a hospital aiming to reduce patient stress might use the PPP lens to train reception staff for better empathy (People), streamline check-in procedures (Process), and redesign waiting areas to be quieter and more calming (Place). It’s a reminder that great service is never just procedural, it’s personal and environmental, too.

The 9 M’s Resource Audit is a strategic framework that scans a firm’s internal capabilities by assessing nine key resource categories: Materials, Machinery, Make-up (brand/image), Management, Management Information, Markets, Men (human capital), Methods, and Money. It’s often used during strategic reviews, business turnarounds, or due diligence processes. For instance, a retail chain facing declining margins might audit its Methods (operational processes), Markets (customer segments), and Management Information systems to uncover inefficiencies or missed opportunities. Think of it as an X-ray for business infrastructure.

The Profitability Framework breaks down profit into its two core drivers: revenue and costs. It’s a go-to tool for consultants diagnosing underperformance, allowing them to zero in on whether declining profits stem from falling prices, lower volumes, rising fixed costs, or bloated variable costs. For example, a restaurant chain suffering shrinking margins might discover that while foot traffic is stable, rising food delivery commissions have quietly eaten into variable costs. The framework simplifies complex operations into a manageable equation (Profit = Revenue – Cost) so you can target the right lever.
RACI Matrix
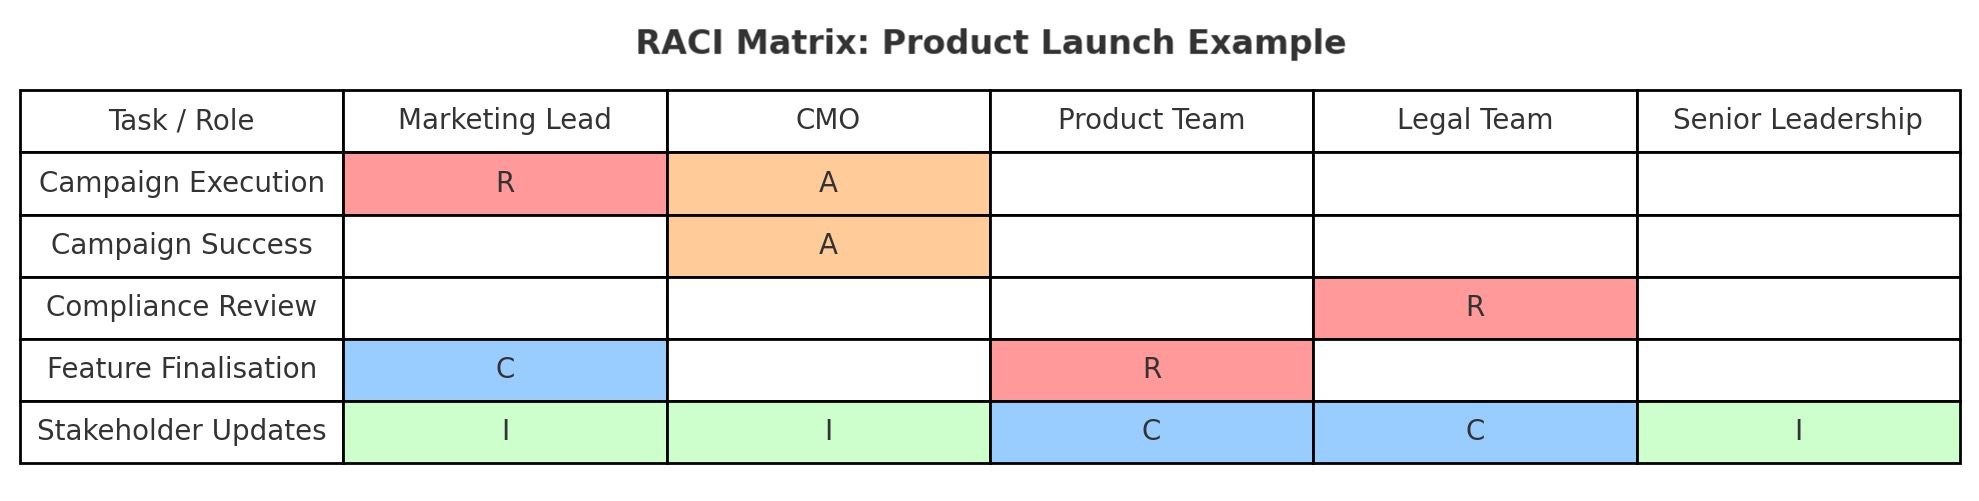
The RACI Matrix is a simple tool for clarifying roles and responsibilities within a project or workflow by assigning four roles: Responsible, Accountable, Consulted, and Informed. For example, in a product launch, the marketing lead might be Responsible for campaign execution, the CMO Accountable for overall success, product and legal teams Consulted, and senior leadership kept Informed. By mapping this clearly, RACI prevents delays, confusion, and duplicated effort, especially in cross-functional teams. It’s a go-to framework for operational clarity and executional discipline.
Theory of Constraints

The Theory of Constraints is a systems-thinking framework that identifies the single most critical limiting factor, or constraint, that prevents a system from achieving its goal, and then systematically works to improve it. It’s commonly used in operations, but also applies to marketing funnels, hiring processes, or any workflow. For example, a manufacturing firm with late deliveries might diagnose that a specific machine is creating a bottleneck, and invest in upgrading or rerouting that stage. TOC simplifies complexity by focusing improvement efforts where they matter most.

Value Chain Analysis maps all the activities a firm performs to deliver a product or service, from inbound logistics to after-sales service, and identifies where value is added, or lost. It’s especially useful in operational strategy and competitive analysis. For instance, a consumer electronics company might find that while their assembly process is highly efficient, delays in inbound logistics are causing costly bottlenecks. By dissecting each link in the chain, firms can streamline operations, strengthen competitive advantage, or decide what to outsource.
VRIO Framework
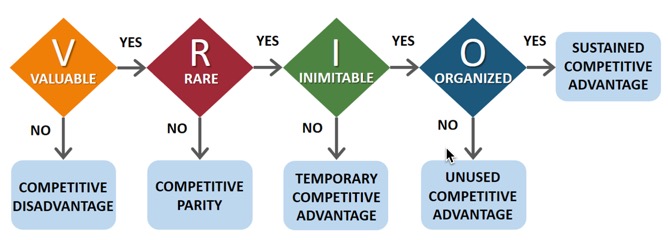
The VRIO Framework helps assess a firm’s internal resources and capabilities by asking four questions: Is it Valuable? Rare? Inimitable? Organised to capture value? If the answer is yes to all four, the resource may deliver sustained competitive advantage. For example, a luxury brand (Valuable) with strong heritage (Rare), iconic design (Inimitable), and a global distribution network (Organised) may have the ability to consistently outperform newer entrants. VRIO is a strategic filter that turns resource audits into insight about where long-term advantage really comes from.
5. Marketing
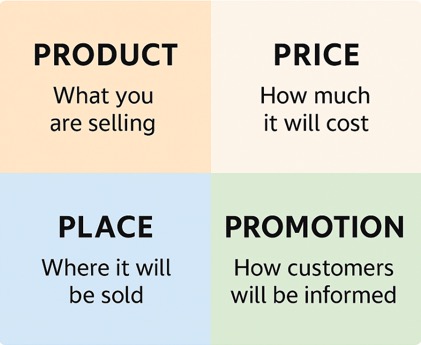
The 4 Ps (Product, Price, Place, and Promotion) form the classic marketing mix, offering a holistic view of how to position and sell a product. For instance, a startup launching a new plant-based protein drink might use the 4 Ps to assess: Product (taste, health benefits), Price (premium vs mass-market), Place (supermarkets, gyms, online), and Promotion (Instagram ads, fitness influencers, in-store sampling). The 4 Ps ensure that marketing strategy touches every point where a brand meets its market.

The Seven Ps of Personal Branding adapts a classic marketing framework to help individuals position themselves with clarity and intent. It prompts reflection across seven elements: Product (your skills and strengths), Price (your value and cost), Place (where you show up), Promotion (how you communicate), People (your network and audience), Physical Evidence (your presence and outputs), and Process (how you operate). For example, a consultant building their online presence might refine their LinkedIn profile (Place), publish thoughtful content (Promotion), and standardise client onboarding (Process). The framework helps professionals craft a consistent personal brand that aligns how they are perceived with who they aim to become.

A Customer Journey Map visualises every step a customer takes when interacting with your brand, from first discovery to purchase and beyond. It highlights moments of delight and friction, allowing businesses to improve experience at critical touchpoints. For example, a SaaS firm might map out how users discover their tool, sign up for a trial, engage with onboarding emails, and ultimately convert, or churn. Journey maps help align teams around the customer experience and are often the first step in service design or UX revamps.
Jobs To Be Done (JTBD)

The Jobs To Be Done framework focuses on the underlying “job” a customer hires a product to do, revealing needs that customers may not be able to explicitly articulate. It shifts the focus from features to outcomes. For example, commuters don’t buy coffee, they instead hire it to keep them alert, signal routine, or create a moment of calm. By understanding the job to be done, a café might redesign its offering to include a pre-order app, calming music, or fast service, rather than offering new flavours or styles of coffee. JTBD reframes product strategy around real-life progress, not surface-level preferences.
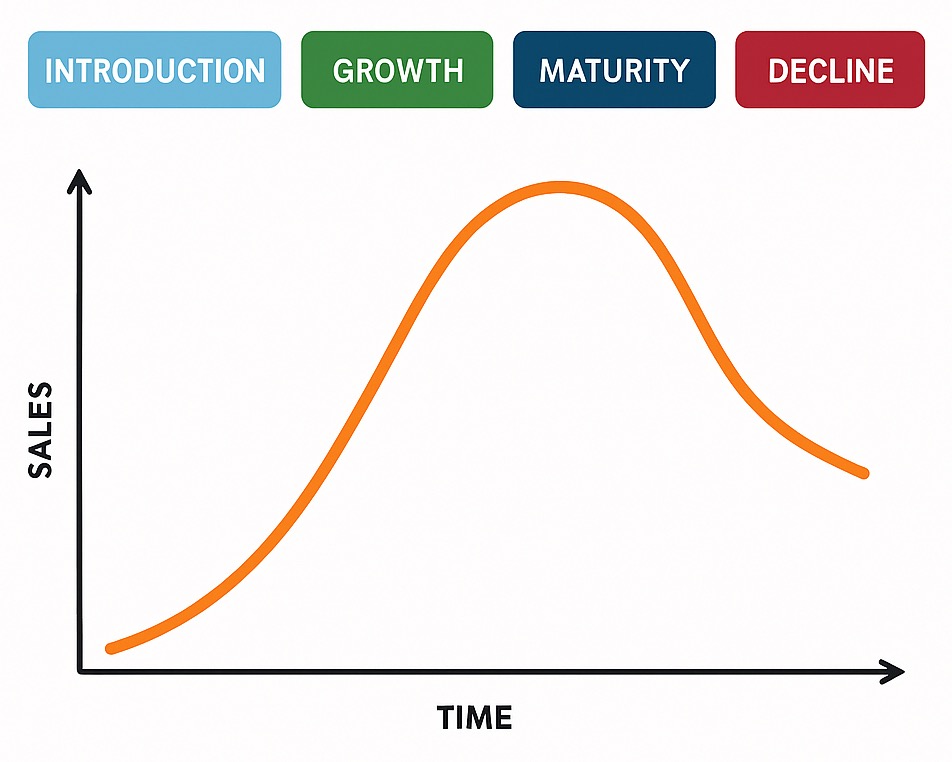
The Product Life Cycle Model tracks a product’s journey through four stages: Introduction, Growth, Maturity, and Decline. Each phase requires different strategies. In the Introduction phase, firms invest heavily in marketing and education. In the Growth phase, the focus shifts to scaling and differentiation. Maturity requires a focus on efficiency and brand loyalty, while Decline might call for a product refresh or withdrawal from the market. For instance, a smartphone brand might see its flagship model transition from rapid sales growth to maturity within 18 months, prompting promotional bundling and R&D to develop the next version. Managers and consultants can use the model to sharpen timing and resource allocation.

A Product Roadmap is a strategic document that outlines the vision, direction, and major milestones for a product over time. It aligns teams across engineering, design, and marketing by showing what features are coming, when, and why. For example, a B2B SaaS platform might use its roadmap to communicate quarterly objectives: Q1 might include improved analytics; Q2, a mobile version. Internally, it sets expectations and focus; externally, it signals credibility and progress to clients or investors. A good roadmap balances ambition with realism and ties every initiative to customer value.
6. Mergers & Acquisitions
Mergers & Acquisitions (M&A) Framework

The M&A Framework divides the analysis of a potential acquisition into two main areas: financial and non-financial considerations. Financially, it assesses whether the benefits exceed the costs. Benefits derive from the intrinsic value of the target company and potential synergies. Costs include the acquisition price and integration expenses. Non-financial aspects focus on cultural and organisational fit, as well as regulatory compliance. For instance, if Apple is contemplating the acquisition of a startup, it would evaluate not only the financial metrics but also the compatibility of company cultures and potential regulatory hurdles. This framework ensures a comprehensive assessment, balancing quantitative analysis with qualitative insights to inform strategic decision-making.
7. Strategy
Ansoff Matrix (Product/Market Expansion Matrix)

The Ansoff Matrix helps businesses think through growth strategy by mapping four pathways: Market Penetration (selling more to existing customers), Market Development (reaching new customer segments), Product Development (creating new products), and Diversification (launching new products in new markets). For instance, a chocolate brand might pursue Market Development by entering the Japanese market, or Product Development by launching a vegan range. The matrix brings clarity to the question: Where should we grow next?

The BCG Matrix helps portfolio managers allocate resources by classifying business units into four quadrants based on market growth and market share: Stars (high growth, high share), Cash Cows (low growth, high share), Question Marks (high growth, low share), and Dogs (low growth, low share). A conglomerate like Procter & Gamble might use the matrix to identify which brands to invest in, milk, divest, or reinvent. The matrix can give a clear snapshot for managing a diversified portfolio with discipline.
Blue Ocean Strategy

Blue Ocean Strategy encourages firms to escape hyper-competitive red oceans and instead create new, uncontested market space, blue oceans, through value innovation. Rather than beating rivals, the aim is to make competition irrelevant by simultaneously increasing value and reducing cost. For example, Cirque du Soleil redefined circus entertainment by removing animals (cost-saving) and adding theatrical elements (value creation). The framework uses tools like the Strategy Canvas and the Four Actions Framework to identify non-customers and design offerings that reshape market boundaries. It’s a bold approach to strategy that rewards creativity and lateral thinking.
Four Actions Framework
The Four Actions Framework challenges businesses to rethink how value is created by asking four powerful questions: What can we Eliminate? Reduce? Raise? Create? It’s used to break away from industry norms and design a new value curve. For example, Cirque du Soleil eliminated animal acts (Eliminate), reduced slapstick humour (Reduce), raised artistic production (Raise), and created a theatrical circus experience (Create). This framework pushes teams to question sacred cows, cut costs strategically, and unlock entirely new markets. It’s the design engine behind many successful Blue Ocean strategies.
The GE-McKinsey 9-Box Matrix extends the BCG approach by evaluating business units across two axes: Industry Attractiveness and Competitive Strength, each with three levels (High, Medium, Low), creating nine possible strategic positions. For example, a multinational might map its various subsidiaries and find that its logistics unit scores high in both areas, suggesting it’s a prime candidate for investment and expansion, while a media division with low scores might be shutdown or sold. It’s particularly helpful for companies with complex, multi-industry portfolios looking for structured strategic planning.
The Market Study Framework is used to assess a new or existing market through four key layers: Economy, Industry, Company, and Project. It helps consultants and investors understand external forces and internal readiness before recommending a go/no-go decision. For example, a private equity firm considering an investment in renewable energy might analyse macroeconomic trends (Economy), market competition (Industry), the target firm’s operations (Company), and the deal structure (Project). The framework ensures a thorough top-down investigation.
McKinsey’s Three Horizons of Growth
The Three Horizons Framework helps organisations balance short-term performance with long-term innovation by structuring initiatives into three categories: Horizon 1 (core business), Horizon 2 (emerging growth), and Horizon 3 (long-term bets). For instance, a bank might treat its digital app as Horizon 1, a new wealth management service as Horizon 2, and blockchain-based payments as Horizon 3. This model helps executives allocate resources across different time frames and risk levels, ensuring today’s success doesn’t come at the expense of tomorrow’s relevance.
OGSM (Objectives, Goals, Strategies, Measures)
The OGSM Framework helps organisations link their long-term vision to short-term execution by organising thinking into four categories: Objective (the big picture aim), Goals (measurable targets), Strategies (broad action paths), and Measures (key performance indicators). For example, a management consulting firm might set an Objective to become a market leader in sustainability consulting, with Goals like “win 10 new ESG-focused clients this year”, and Strategies that include thought leadership and partnerships. OGSM distils strategy into a compact format that aligns teams and drives accountability.
The Outsourcing Matrix helps firms decide which activities to keep in-house versus outsource, based on Strategic Importance and Operational Performance. For example, a car manufacturer may find that its IT infrastructure isn’t strategically core and its performance is poor, making it a strong candidate for outsourcing. Conversely, it might retain control of engine design because it’s central to brand identity and technical excellence. This matrix supports smart resource allocation and risk management in complex operations.
PEST Analysis examines the Political, Economic, Social, and Technological forces shaping an industry or market. It’s typically used in strategy development, market entry assessments, or risk scans. For example, a renewable energy startup expanding into Southeast Asia might consider government subsidies (Political), currency volatility (Economic), consumer environmental attitudes (Social), and battery storage innovation (Technological). PEST doesn’t provide answers, but it ensures no external factor is overlooked when building strategy or pitching to investors.
PESTLE Analysis
PESTLE Analysis expands the classic PEST framework by adding Legal and Environmental factors, creating a six-lens scan of external forces: Political, Economic, Social, Technological, Legal, and Environmental. It’s especially valuable when entering new markets or navigating regulatory risk. For example, a pharmaceutical firm launching into the EU might use PESTLE to assess pricing controls (Political), demographic trends (Social), data privacy laws (Legal), and sustainability mandates (Environmental). It doesn’t tell you what to do, but it ensures you don’t overlook what matters in the environment around you.
Porter’s Five Forces is a powerful industry analysis framework that evaluates competitive intensity based on five factors: Supplier Power, Buyer Power, Competitive Rivalry, Threat of Substitutes, and Threat of New Entrants. For instance, a new online grocer might assess that there is intense rivalry (many competitors), high buyer power (consumers can switch easily), and moderate supplier power (a small number of delivery services). If all five forces are strong, profit margins are likely to be thin. Porter’s model helps firms understand where power lies in the industry, and whether to enter, invest, defend, or exit.
Porter’s Generic Strategies describe three primary ways firms can gain competitive advantage: Cost Leadership (being the low-cost provider), Differentiation (offering something unique), and Focus (targeting a niche with one of the first two approaches). For example, Aldi uses Cost Leadership by streamlining operations, Apple employs Differentiation through appealing design and a tightly controlled ecosystem, and a boutique legal firm might use Focus to serve only tech startups. The framework reminds firms to choose a clear path or risk being “stuck in the middle.”
Porter’s Six Steps of Strategic Positioning
Porter’s Six Steps of Strategic Positioning outline how to build a sustainable strategy by focusing on activity alignment and unique value delivery. The steps include identifying the right customer, defining the value proposition, and arranging activities to reinforce one another. For example, IKEA’s self-service warehouse, flat-pack design, and limited customer service all reinforce its low-cost home furnishing strategy. The power of this framework is not in choosing what to do, but in designing a system that coherently delivers it.
Strategy Canvas
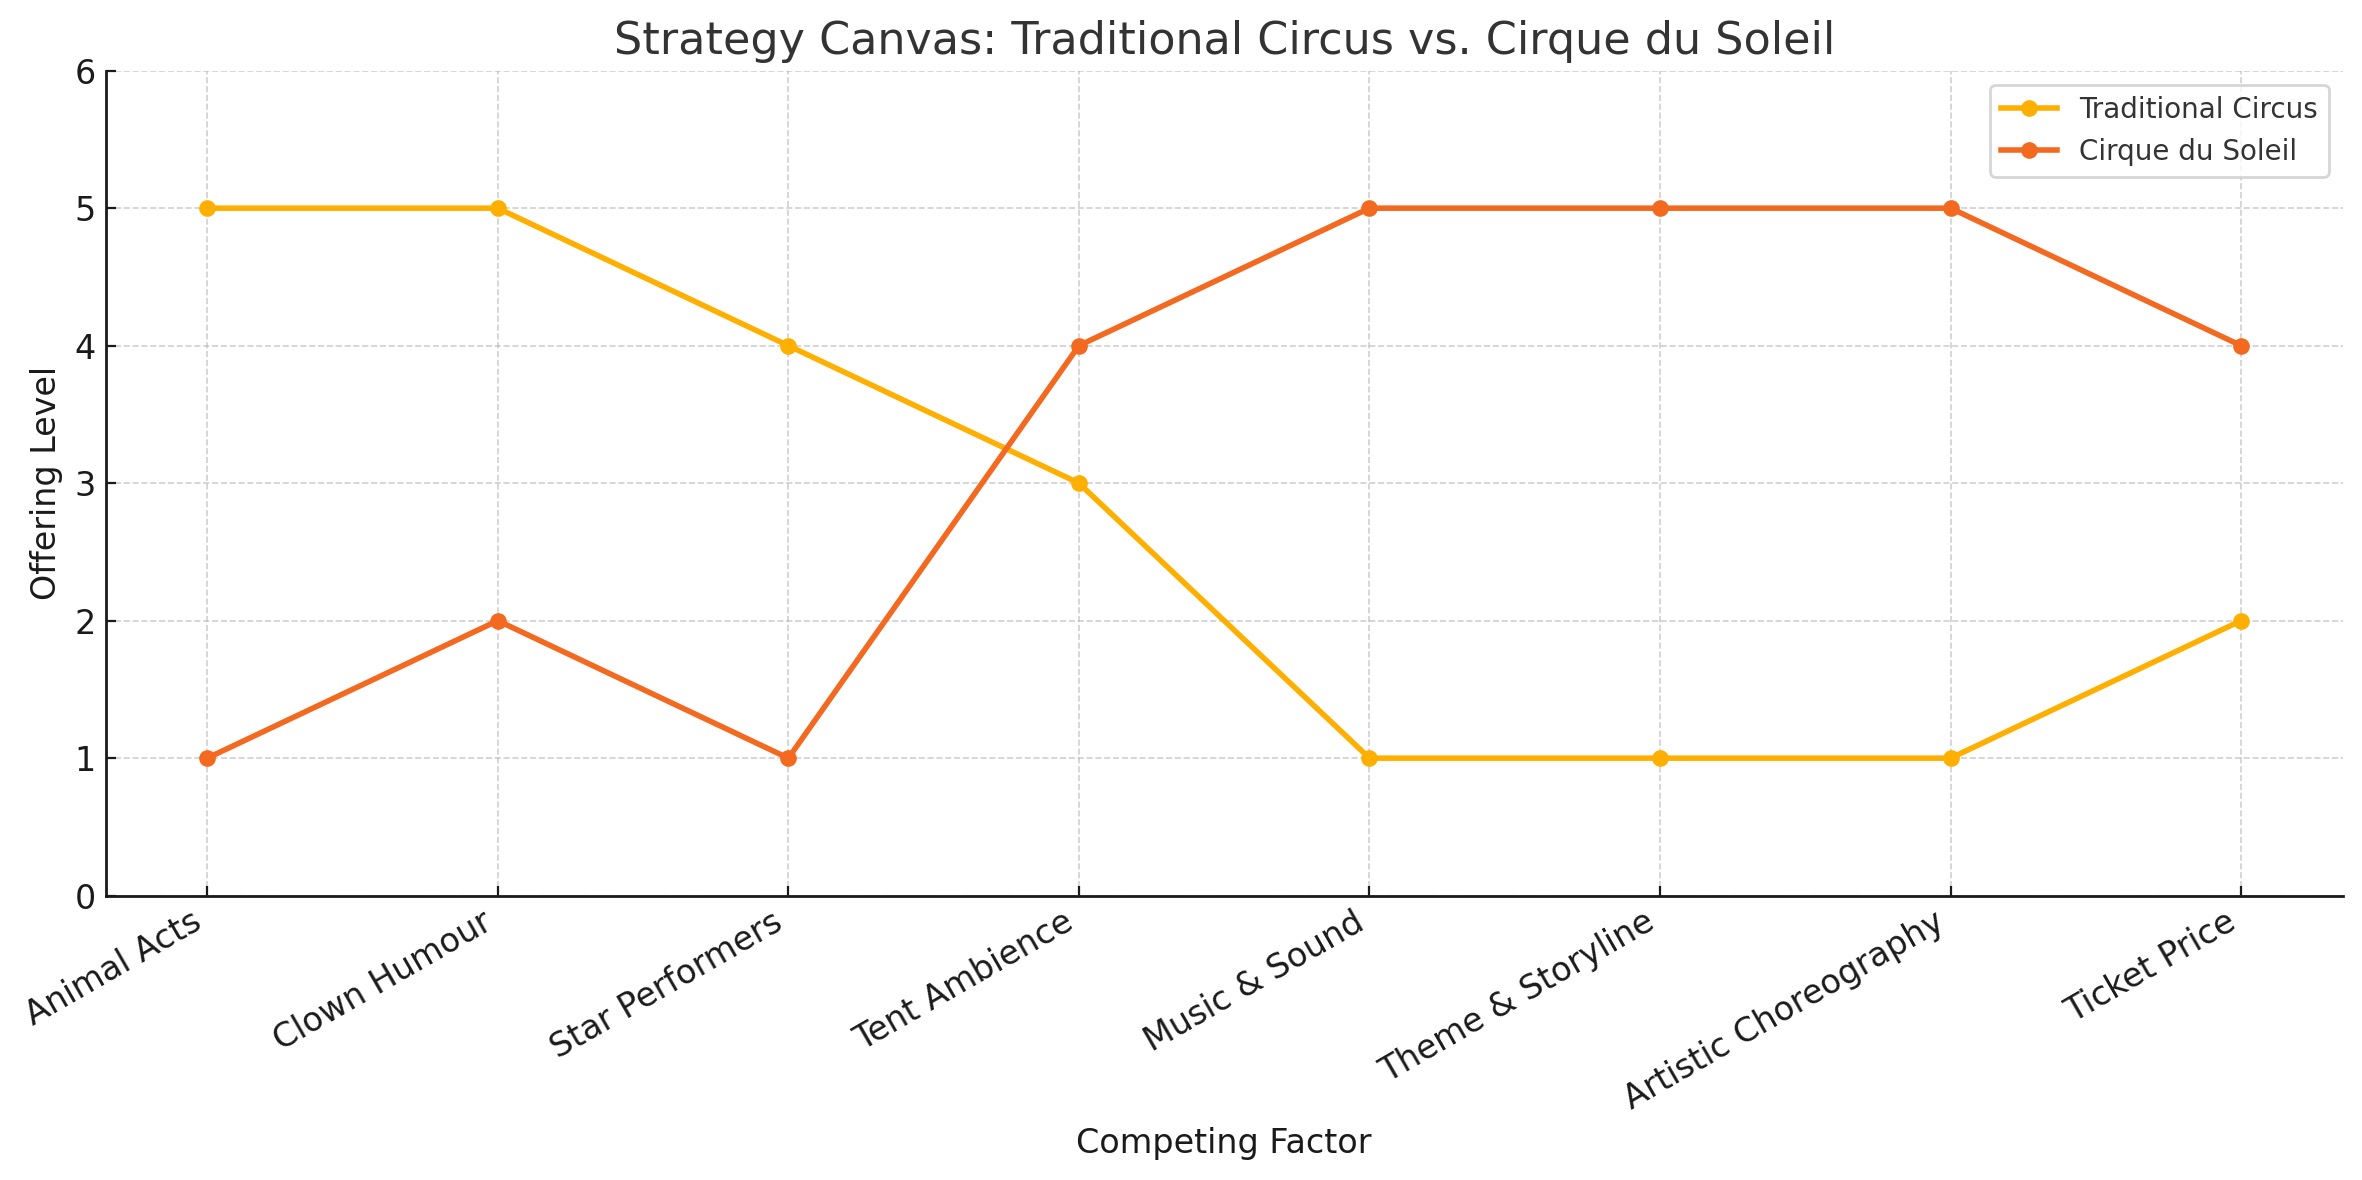
The Strategy Canvas is a visual tool from Blue Ocean Strategy that maps how industry players perform across the key factors that customers care about, revealing the state of competition and where opportunities for differentiation lie. The horizontal axis shows the factors of competition e.g. price, quality, or product features, while the vertical axis shows the level of offering e.g. from low to high. Each competitor’s performance is plotted as a line, its ‘value curve’. For example, in live entertainment, traditional circuses score highly on animal acts and clown humour, but offer little in the way of music, storyline, or artistry. Cirque du Soleil flipped the script and created a new kind of theatrical experience by eliminating animals, reducing clowning, and raising artistic elements. The Strategy Canvas helps teams see the industry’s assumptions in one view and identify bold ways to break away from the crowd.
SWOT Analysis is a foundational strategy tool that helps firms identify Strengths, Weaknesses, Opportunities, and Threats. It’s used in everything from strategic planning to investor pitches. A local café, for instance, might list its community loyalty as a Strength, reliance on foot traffic as a Weakness, delivery services as an Opportunity, and a new franchise competitor as a Threat. SWOT is deceptively simple, but forces holistic reflection across internal capabilities and external conditions.
The Three C’s (Customer, Company, and Competition) are the cornerstone of market analysis. It asks: What do our customers need? What can we offer? How does that compare to rivals? For example, a car brand planning an EV launch might explore rising environmental awareness (Customer), its own battery tech and design strengths (Company), and Tesla’s first-mover advantage (Competition). The Three C’s frame strategic positioning as the intersection of market need, capability, and differentiation.
The Value Net Framework extends Porter’s Five Forces by adding a crucial sixth actor: Complementors. These are firms whose offerings increase the value of your own. For example, consider the relationship between iPhones and app developers. More apps make iPhones more valuable, and vice versa. The framework repositions strategy from pure competition to co-opetition, recognising that value is often created with others, not just in spite of them. It’s a nuanced tool for navigating modern, interconnected markets.
8. Structured Thinking
6 Thinking Hats

Six Thinking Hats, a framework developed by Edward de Bono, is a tool for group discussion and individual reflection that separates thinking into six distinct modes: White (facts), Red (feelings), Black (caution), Yellow (optimism), Green (creativity), and Blue (process control). By deliberately adopting one “hat” at a time, teams can avoid unproductive argument and engage in more structured, balanced decision-making. For example, during a product launch meeting, the team might start with White Hat thinking to review market data, then switch to Green Hat to generate promotional ideas, and finally use Black Hat to assess risks. The framework encourages parallel thinking, reduces conflict, and promotes clarity by ensuring each perspective gets a fair hearing.
Bloom’s Taxonomy – Six Levels of Thinking
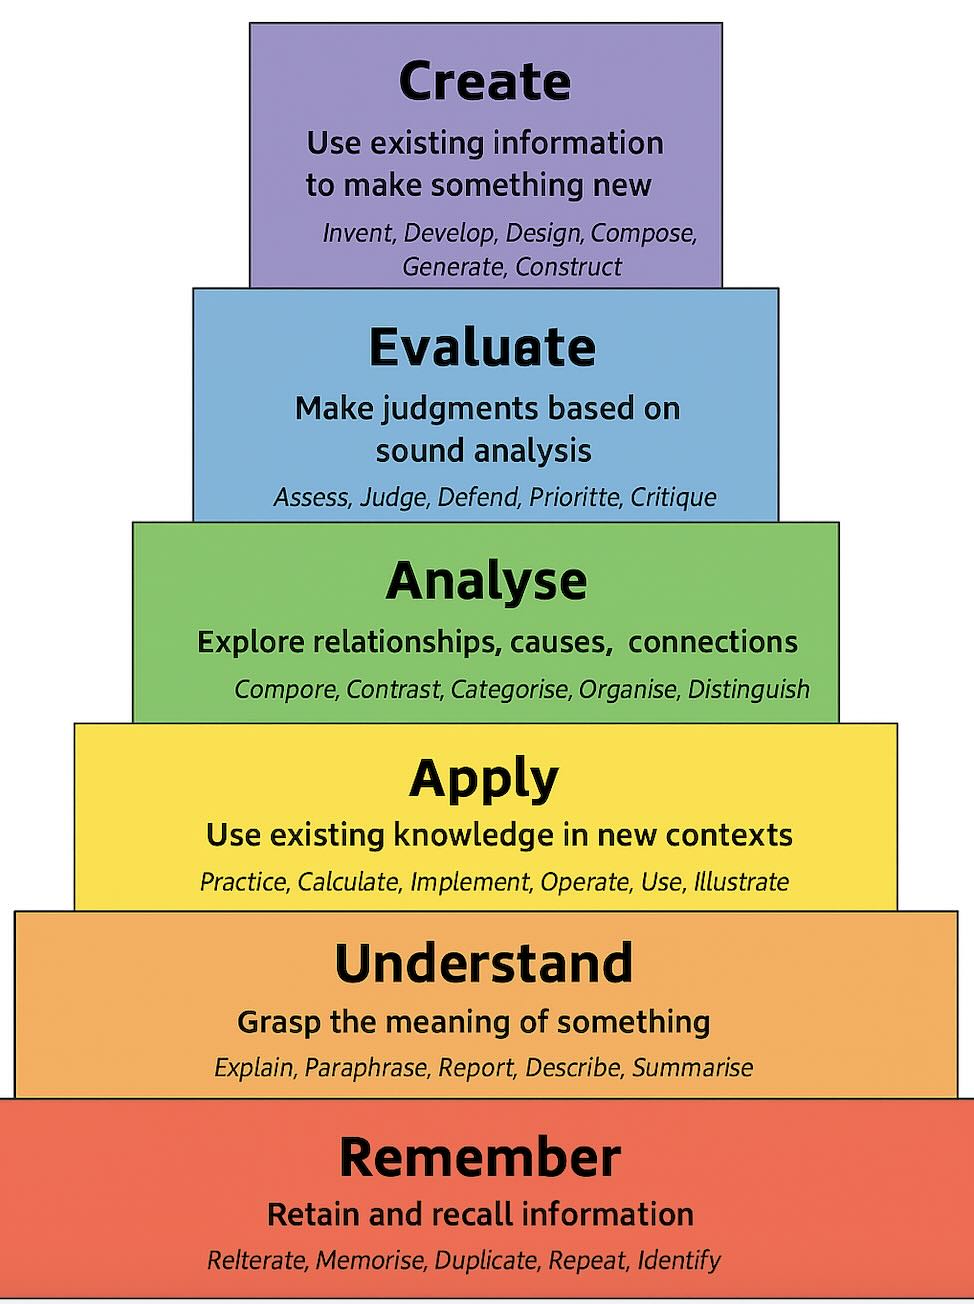
Bloom’s Taxonomy is a hierarchical model that categorises thinking into six progressively more complex levels: Remember, Understand, Apply, Analyse, Evaluate, and Create. Originally developed to guide educators, it has become a powerful tool for consultants, strategists, and knowledge workers aiming to sharpen problem-solving and communication. For example, a strategy team might begin by recalling key facts about a market (Remember), interpret trends (Understand), run simulations (Apply), compare business models (Analyse), assess viability (Evaluate), and finally craft a new go-to-market plan (Create). The framework encourages deliberate thinking, moving from surface-level recall to deep insight.
Feynman Technique
The Feynman Technique is a learning framework built on the idea that true understanding comes from being able to explain a concept simply to a child. Named after Nobel physicist Richard Feynman, the process involves four steps: choosing a concept, explaining it as if teaching a 12-year-old, identifying knowledge gaps, and refining the explanation. For example, a strategy consultant trying to master blockchain might write out a plain-English explanation, stumble on how decentralised ledgers work, return to research, and refine the explanation until it’s crisp and jargon-free. The Feynman Technique is particularly useful any time clarity of thought matters more than technical complexity, e.g. when for preparing presentations, interviews, or client briefs.
First Principles Thinking

First Principles Thinking is a reasoning method that breaks complex problems down into their fundamental components, what must be true, and builds up from there, rather than relying on analogies or conventional wisdom. Popularised by Elon Musk, this approach is especially powerful for innovation and product strategy. For example, instead of assuming batteries must be expensive because they always have been, a team using first principles might deconstruct what batteries are made of, cost each component from scratch, and explore alternative raw materials. The framework encourages original thinking and is a potent antidote to the adage “we’ve always done it this way”.
Hypothesis-Based Problem Solving (HBPS)

HBPS is a structured approach used by consultants and analysts to tackle complex problems by breaking them down into falsifiable hypotheses. Rather than boiling the ocean, it guides you to focus only on the issues that matter most. For example, if a retailer is experiencing falling sales, HBPS would prompt the team to prioritise analysis by testing plausible hypotheses: Are prices too high? Is customer foot traffic down? Are online reviews affecting trust? This method is efficient, logical, and highly effective in environments of uncertainty.

MECE (Mutually Exclusive, Collectively Exhaustive) is a logic-based organising principle that ensures you don’t miss anything or double-count when breaking down a problem. It’s a cornerstone of consulting case structure. Suppose you’re segmenting a customer base: a MECE grouping might separate by age group (18–25, 26–35, etc.), which is mutually exclusive, and cover the entire population, making it collectively exhaustive. Using MECE ensures clarity, precision, and no overlaps—ideal for building issue trees, structuring recommendations, or preparing polished slides.
Mind Mapping
Mind Mapping is a visual thinking tool that helps structure information, uncover relationships, and spark creative insights by representing ideas as nodes branching from a central concept. Popularised by Tony Buzan, it’s especially useful when tackling open-ended problems, synthesising research, or preparing presentations. For example, a consultant planning a market entry strategy might start with “Target Market” at the centre, then map out branches like customer segments, regulatory factors, distribution channels, and competitors — quickly building a visual model of the landscape. The non-linear format mirrors how the brain actually processes ideas, making it easier to identify gaps, spark connections, and avoid tunnel vision. Mind Maps are a go-to tool when clarity needs to emerge from ambiguity.
SQ3R Method
The SQ3R Method (Survey, Question, Read, Recite, Review) is a structured approach to reading for comprehension that transforms passive reading into active learning. Originally developed for academic study, it’s also used by consultants and analysts who need to deeply absorb complex material.
- Survey the text to get an overview – Look at things like the title, subheadings, italicised text, diagrams, summary, and review questions.
- Question what you expect to learn – Convert titles and subheadings into questions, and write these down.
- Read actively for meaning – Answer your key questions, and write down any important information.
- Recite key ideas in your own words – Talk out load, and research any information that you can’t explain clearly enough.
- Review the material – Frequently reread your notes to better retain the information.
For instance, a consultant preparing for a due diligence project might use SQ3R to digest a dense industry report, extracting key insights more reliably and with greater clarity than through casual skimming. The method turns information overload into structured knowledge acquisition.
🔴 Found these ideas useful?
Sharpen your edge