
How do banks make money? Where does this money ultimately go? What is a bank really worth?
In this 2-part series, we will address these questions. Firstly, by outlining the major items on a bank’s income statement, and then by discussing key ratios that are commonly used to measure profitability and to estimate the market value for banks.
Bank’s Income Statement
It’s important to note that banks have diverse product offerings and client types, and the reporting of business lines such as retail banking, wholesale banking, and wealth management can vary between different banks. For the sake of simplicity, we will present the information in a consolidated manner.
A bank’s income statement can be simplified into five main line items:
- Net interest income
- Non-interest income
- Operating expenses
- Provision for credit losses (PCL)
- Tax
Image 1: Illustrative example of a bank’s income statement
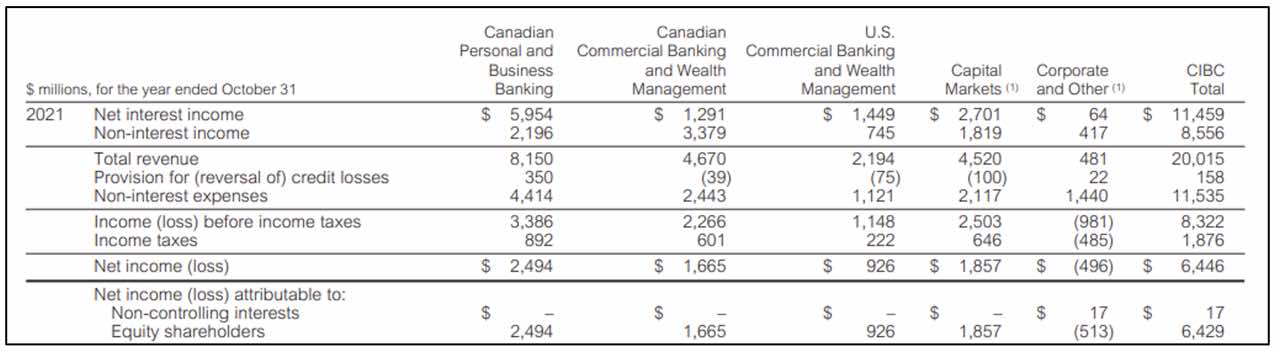
Source: CIBC’s 2022 Annual Report
1. Net interest income
This is the revenue generated by lending money at a higher rate than borrowed (i.e., the spread). Net interest income is the net difference between interest earned on assets, such as loans and fixed income securities, less interest paid on liabilities, such as deposits. Typically, net interest income comprises more than half of total revenue, with smaller banks typically generating a larger proportion of total revenue from this line item compared to large regionals and big banks.
The interest rates at which banks borrow and lend money are influenced by the interest rates established by the central bank. The interest rate set by the central bank serves as a benchmark or reference rate for banks. Banks typically adjust their lending rates based on the central bank’s policy rate. When the central bank lowers rates, banks often pass on the rate cut to borrowers, making loans more affordable. Similarly, when central banks raises rates, banks increase their lending rates to maintain profitability.
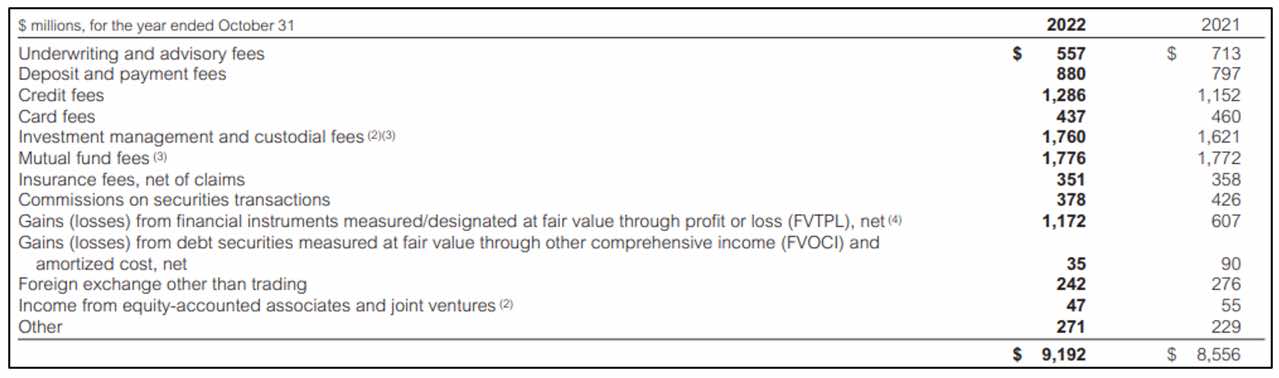
2. Non-interest income
This is the revenue generated from fees, typically accounting for around 40% of industry revenue, including:
- deposit service charges (e.g., monthly account fees, overdraft charges)
- gain on sale of loans
- mortgage servicing fees
- credit card fees
- trust, brokerage and asset management services
- investment banking fees
- brokerage fees
- insurance premiums and fees
- private equity management fees and carried interest
In recent years, banks, particularly big banks, have been expanding the proportion of income generated by these drivers through acquisitions, partnerships, and investments in order to diversify their revenue streams and fuel organic growth.
Image 2: Illustrative example of a bank’s non-interest income
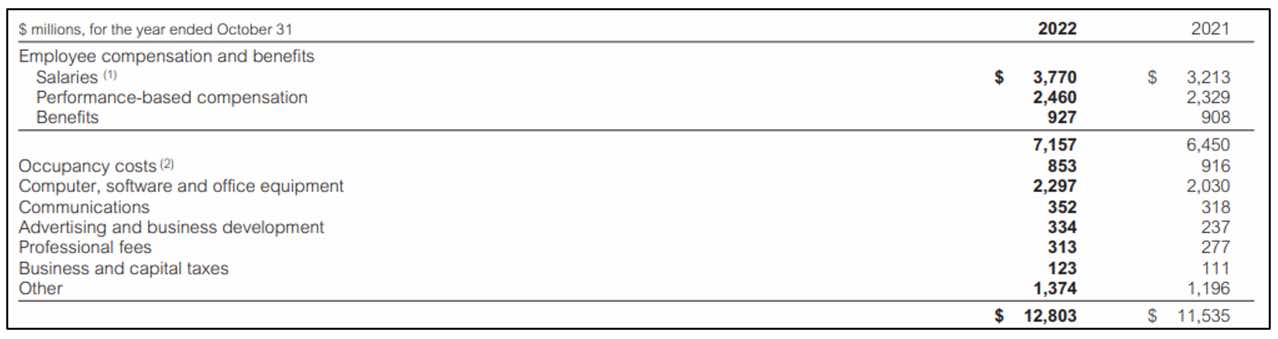
3. Operating expenses
Operating or non-interest expenses will be affected by many moving parts such as wages, benefits, infrastructure, and information technology. They should not be looked at in isolation. Normal pressure on banks due to growing operations expenses is likely to continue, although the rate of growth should slow as banks focus more attention on their expenses in the near term.
The biggest swing in operating expenses is likely to be variable compensation. This means that declines in operating expenses might be interpreted as positive if expenses are looked at in isolation. In fact, falling operating expenses may be a negative indicator that suggest declining overall profitability because, implicitly, bank revenues are likely to be down.
Tracking operating efficiency is important but you should focus on trends over time rather than comparing absolute numbers among banks because operating efficiency is heavily influenced by business mix and does not take into account capital requirements or risk.
Image 3: Illustrative example of a bank’s operating expenses
4. Provision for credit losses (PCL)
PCL represents an estimated amount that a bank sets aside to cover potential losses on loans and other credit exposures. Credit losses on loan portfolios vary and are clearly a cyclical component of banks earnings. PCL generally goes up when there is an unfavorable change in the economic outlook, while PCL typically goes down when there is a favorable change in the economic outlook.
PCL includes:
- charge-offs during the period
- loan loss provision to absorb potential future losses on loans and credit exposures
PCL is an important indicator of a bank’s prudence in managing credit risk. It reflects the bank’s assessment of potential losses it may incur and its commitment to maintaining a strong balance sheet. Additionally, it provides insights into the overall quality and soundness of a bank’s loan portfolio.
5. Taxes
Banks pay corporate taxes, and the tax rate needs to be tracked as it can have a material impact on the bottom line. Income tax and indirect tax are two additional types of taxes levied by governments. Income tax is a direct tax imposed on banks based on their taxable income. Indirect tax refers to taxes imposed based on the consumption, sale, or use of goods and services.
Concluding Thoughts
Keeping track of the major income statement items on a quarterly basis is a good practice if you want to stay updated with industry news and understand the strategic direction that banks are taking.
By analyzing these items, investors, analysts, consultants, and individuals interested in the banking sector can gain insights into a bank’s financial performance and identify trends or changes that may impact profitability and overall stability.
While not covered in this article, being aware of banks’ capital requirements is also crucial (e.g., Common Equity Tier 1 (CET1) ratio). Banks are required to maintain a certain level of capital as a safeguard against various risks they face, including credit risk, operational risk, market risk, and liquidity risk. Monitoring capital adequacy ratios and capital levels is important to assess a bank’s ability to absorb losses and operate in a financially sound manner. Recent headlines about the fall of Silicon Valley Bank and other regional US banks serve as reminders of the significance of capital requirements.
Jason Oh is a Senior Associate at Strategy& with a focus on financial services. Previously, he was part of the Global Wealth & Asset Management Strategy team of a large financial institution and served EY and Novantas in their strategy consulting practice.
Image: Pixabay
Follow us now on LinkedIn.
🔴 Found these ideas useful?
Sharpen your edge
One reply on “Bank Profitability: Decoding the Income Statement”
[…] the previous article, we looked at how banks make money and how they must meet capital requirements. In this article, we […]